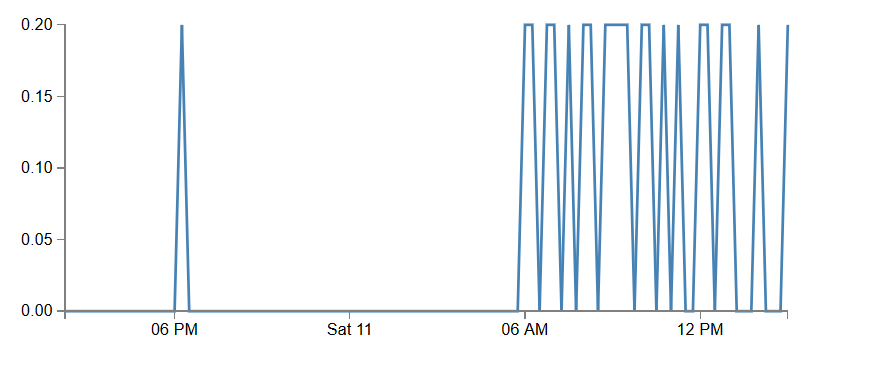
Previously I’ve managed to display a simple d3.js visualisation on the site through a couple of different methods. Next step is to go from proving a general concept to actually displaying some data that might be interesting.
So, what steps did I go through:
1. Find some lovely data
I wanted something interesting to play with that was home related; Mendip Council’s open data offerings are less than impressive, so national agencies it is; I recalled there was and there’s a rainfall monitoring station only a mile or so from home. So why not try to build a graph that shows recent rainfall (say, the last 100 recording incidences) for where I live (notwithstanding the obvious empirical alternatives to understanding like looking out of the window)
The data is already well defined and it was easy to determine the Frome station (531108) thanks to the EA API demonstrator.
A bit of digging with that demonstrator showed it is possible to call a .csv file with the data that I want to visualise in a fairly basic three column format.
2. Find a viz
I have found a simple chart I like the look of (well, actually it’s ugly as hell, but I’ve got a load of time data and a value – a basic line chart is a good starting point.)
First thing I did was upload the csv and the html files to my site to check that there wasn’t something odd that WordPress might do with them.
3. Make that viz look at the data
Now I need to stick my data to the viz. The data being produced by the .csv associated with that example vis obviously doesn’t look like my EA data. I got the index.html into a text editor and started to look at the variables I think define the data.
4. The Detective work 1) Date formatting
The Environment Agency data isn’t in the same format as that in the example. So finding the right bit of code which determines that was the first job. It’s
var parseDate = d3.time.format("%d-%b-%y").parse
(which was easy to determine thanks to excellent notation in the d3 code)
D3 has its own formatting guidelines (the documentation was comprehensive and made a broad level of sense. We are relatively fortunate in that our EA data comes in a standard ISO data format for date/time (ISO 8601). A bit of googling gave a d3 format with which to replace the bits in the “”, specifically
"%Y-%m-%dT%H:%M:%SZ"
(source)
5) More detective work 2) Calling the csv file.
Rather than calling from a static csv file already on my site, I want to link to that live csv (that’s the exciting bit)
d3.csv("http://intelligentplaces.org.uk/wp-content/uploads/2017/02/lineclean.csv", function(error, data) {
 data.forEach(function(d) {
 d.date = parseDate(d.date);
 d.close = +d.close;
 });
I want to get it from the csv I discussed earlier. Which means fiddling with this a bit…
I *think* the d.{variable} bit is where we’re telling d3 how to handle the individual column in the csv.
Assuming that is the case, then I tried
d3.csv("http://environment.data.gov.uk/flood-monitoring/id/stations/531108/readings.csv?_limit=100&_sorted¶meter=rainfall", function(error, data) {
 data.forEach(function(d) {
 d.DateTime = parseDate(d.date);
 d.value = +d.close;
And…
Nothing.
A whole page of blankness.
6) Error checking – following through the fields (and double checking blank values).
Now the fact that there is simply nothing to be seen leads me to believe that either the data is simply not there (and because the data is defined relative to itself, there’s nothing to show from nothing) or that I’ve bodged up one of the above. I’ve no idea whether there’s error handling built into this – I’m assuming not.
First I did a formatting/sense check on the code; I amended all the other references to the previous fields with my newly defined ones and I got a really boring graph
Now it’s not rained much recently (it’s snowed a bit, but I’m guessing a “tipping bucket” needs a bit more than some wimpy flurries to register).
So I swapped weather station URL for somewhere near the Pennines (559100R) where there’d been a bit more rain recently and…
 Whooop!, data, visualized using code and linked to a live source.
I have now reset the live data back to Frome.
7) Note next steps.
This worked to prove the concept; but there’s a lot more to do before
- Find a way of displaying something when there’s no data because of a nil return, as opposed to a processing error, can’t immediately tell at the moment.
- Find a visualisation that
isn’t boring as hell.is more visually appealing
- Find out more about the underlying data, could there be some some appropriate presets for the axes?.
- Work out how to have a bit more control over the x axis, those dates aren’t pretty and labelling is essential.
- Marvel at the decades you’ve been working with data and only just discovered that axes is the plural of axis.
